
01 · FOCUS
Hold representative demand steady
Choose a rate the service may sustain for long periods. Testing only at maximum capacity can mask time-dependent defects behind immediate saturation.
Short benchmarks find immediate bottlenecks. They are weak at revealing memory growth, leaked connections, exhausted pools, background backlog, cache churn, or slowly rising tail latency. Soak testing keeps a representative workload steady long enough for time-dependent failure modes to surface.
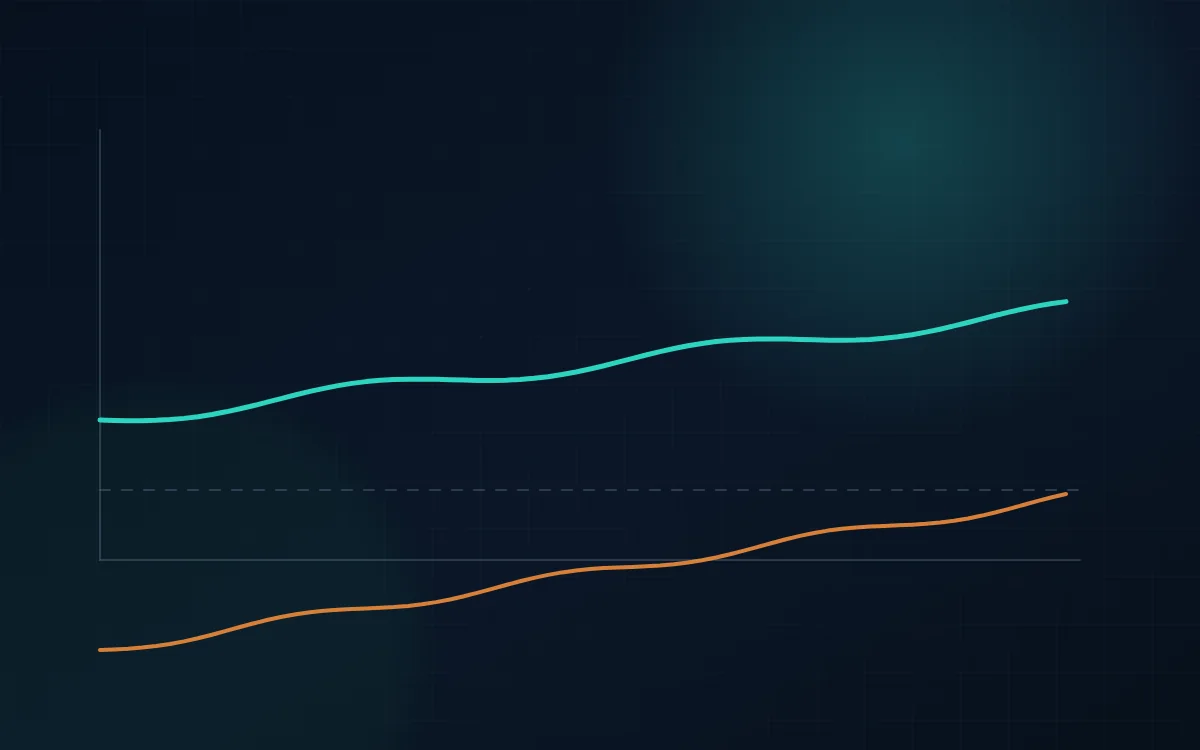
Watch latency, memory, queues, and pool usage over time.
Look for retries, handles, files, sessions, and background work that never fully clear.
Compare the final hour with the first stable hour, not only the run average.
The strongest soak-test evidence is a set of slopes. A metric that grows slowly for six hours can be more important than a metric that spikes once and recovers.
Look for monotonic growth after warm-up.
Stable throughput with growing backlog is still failure.
Watch for gradual exhaustion and incomplete cleanup.
Separate warm-up from sustained deterioration.
Soak testing deliberately keeps demand stable so elapsed time becomes the pressure. If performance degrades while traffic stays constant, the investigation can focus on accumulating state, resource lifecycle, and scheduled operational behavior.
Choose a rate the service may sustain for long periods. Testing only at maximum capacity can mask time-dependent defects behind immediate saturation.
One aggregate average can hide gradual drift. Compare p95 and p99 across early, middle, and late windows so slow degradation remains visible.
Memory leaks, file handles, connection pools, thread exhaustion, and unbounded caches may need thousands or millions of operations before their impact becomes measurable.
Backups, cache refreshes, batch jobs, log rotation, or scheduled consumers can collide with normal online load. A long run is useful only if it crosses the cycles relevant to the risk.
A service can keep returning 200 responses while asynchronous queues grow. Pair HTTP metrics with queue depth, lag, or job completion when the user action depends on background processing.
Keep traffic stable enough that early and late windows are comparable. The core question is whether the same demand costs more latency or produces more failures after hours of operation.
Longer is not automatically better. Choose a run length that crosses the lifecycle or operational process you are trying to test, then keep the workload consistent enough to attribute drift to time.
Use a realistic busy-hour or steady-state rate with enough headroom to avoid immediate saturation.
Set acceptable latency and error ranges plus target-side limits for memory, queues, or connections.
Include scheduled jobs, refreshes, token rotation, or other timed behavior that may interact with load.
Inspect early, middle, and final segments rather than relying on one aggregate summary.
Repeat the same duration and workload; a real fix should flatten the drift, not merely delay it.
A soak test keeps a service under representative load long enough for time-dependent problems to emerge. The interesting failures are often subtle: memory climbs slowly, pools fragment, queues drift upward, caches change behavior, logs fill disks, or a dependency accumulates enough state to become slower hours into the run.
There is no universally correct soak-test length. A useful duration is long enough to cross the lifecycle that could cause the problem. If you are checking a connection leak that appears after thousands of requests, the test may only need a few hours. If certificates, token rotation, cache expiration, scheduled jobs, daily data partitions, or log rotation are part of the risk, the run should cross those events. Build a realistic traffic mix rather than holding one endpoint at a perfectly constant rate for twelve hours. Production systems usually have reads, writes, authentication refreshes, background work, and periodic bursts. Keep demand stable enough that trends remain interpretable, but include the state transitions that matter to the system. Record deployment version, instance count, data volume, and dependency versions before the run. Without that context, a slow drift can be difficult to reproduce. The most valuable soak tests are designed around a suspected time-dependent mechanism rather than a round number such as “run overnight.”
A short performance test asks whether a metric is acceptable at a point in time. A soak test asks whether that metric is moving in a dangerous direction. Plot memory, open connections, queue depth, thread count, file descriptors, cache size, database sessions, temporary storage, and background-job age over the entire run. A value can remain inside its nominal limit while exhibiting a steady upward slope that will eventually cause failure. Compare resource growth with completed work so you can estimate accumulation per thousand requests or per hour. Latency percentiles should also be trended because gradual tail growth can indicate fragmentation, garbage collection pressure, larger data sets, or a slowly deteriorating dependency. When the service periodically returns to a lower resource level, note the cycle: that can show successful garbage collection, cache eviction, connection recycling, or scheduled cleanup. The absence of a reset where one is expected is itself a useful finding. Long-run evidence should make the direction of the system visible, not just produce one average latency number.
Long tests interact with the operating environment in ways short tests do not. Log files rotate, metrics buffers flush, tokens expire, autoscaling changes the host population, deployments may occur, and background maintenance competes for resources. Make those interactions part of the test plan instead of treating them as noise. If a service relies on a database pool, observe whether connections are recycled cleanly. If workers consume from a queue, verify that backlog does not grow slightly faster than it drains. If an application writes temporary files, track disk growth. For stateful systems, check whether the data created by the test changes query cost as the run progresses. You should also watch the load generator: a memory leak or connection limit in the test infrastructure can create a false conclusion about the target. A good soak run includes periodic checks of achieved request rate and generator health so a declining client-side capability is not mistaken for stable application capacity.
Do not stop collection the moment the scheduled duration ends. Reduce the test to baseline or zero traffic and watch whether accumulated resources return to their expected state. Memory may remain allocated by design, but queue depth, active requests, temporary work, connection usage, and error rate should normalize in a predictable way. Document any metric that fails to recover and whether manual intervention was required. When fixing a suspected leak or drift, compare trend slopes rather than only comparing final values. For example, reducing memory growth from 200 MB per hour to 10 MB per hour is meaningful even if neither run reached an out-of-memory failure. Store the full time series or representative checkpoints because long-run regressions are easy to miss in summary statistics. Over time, a stable soak scenario can become part of release qualification for components with known lifecycle risks. It is especially useful after changes to connection management, caching, background jobs, serialization, logging, or libraries that manage native resources.
Long-run tests need time context. Preserve trends and lifecycle events so slow drift can be separated from periodic cleanup, scheduled work, or ordinary resource cycling.
For memory, connections, file descriptors, queue age, temporary storage, cache size, and other accumulators, calculate or visually inspect the slope over time instead of only the maximum. A metric that remains below a limit during an eight-hour run can still prove a leak if it rises steadily and never resets as expected.
Record token rotations, log rotation, scheduled jobs, cache expiration, deployments, autoscaling changes, backups, data compaction, or other timed activity crossed by the soak window. These annotations help explain sudden changes in latency or resource use and make a time-dependent defect reproducible instead of looking like random noise.
After stopping or reducing traffic, record whether queues drain, active connections fall, temporary data is removed, and error rates normalize. Compare the final steady state with the pre-test baseline. Persistent drift after traffic ends can reveal leaked resources or background work that a normal load-test summary would never show.
End with a statement about slope and sustainability: which resource accumulates, at what approximate rate, and whether the observed growth would become unsafe over the intended production lifetime. That is more actionable than saying the service survived a fixed number of hours without crashing.
Use LoadTester when a repeatable HTTP workload needs to run long enough to expose slow degradation. Pair the client-side result with application and infrastructure telemetry to see whether user-facing behavior changes as resources accumulate.
The continuous load testing guide explains how recurring baselines and scheduled checks fit alongside short CI gates and deeper pre-release validation.
Read the continuous load testing guide →The page now gives soak-specific trend analysis instead of treating duration as just a longer load test.
Reviewed by Kristian Razum, founder & principal engineer at LoadTester. Technical claims are framed as test-design guidance; no benchmark numbers are invented on this page.
Soak testing runs a representative workload for an extended period to find degradation that depends on elapsed time or repeated operations. Typical targets include memory leaks, connection exhaustion, queue buildup, and gradually increasing latency.
Long enough to cross the suspected failure mechanism or operational cycle. That might be a few hours for a connection leak, a business day for queue accumulation, or longer for a defect tied to scheduled processes.
Usually not. If the system is already near saturation, immediate capacity effects can mask slow degradation. A realistic sustained load with headroom makes time-dependent behavior easier to identify.
Define failure before the run: latency drift beyond a budget, rising error rate, inability to sustain throughput, or target-side resource growth that does not stabilize. The criteria should match the production risk being investigated.
Run a stable workload, compare performance across time, and turn drift into something the team can reproduce.