
01 · FOCUS
Model the speed of the event
Reproduce how fast traffic changes, not only the final peak. A jump from 100 to 1,000 RPS in seconds exercises different behavior than a ten-minute ramp to the same level.
Campaigns, push notifications, ticket drops, breaking news, login waves, and retry storms can multiply demand faster than autoscaling or caches can react. Spike testing reproduces that transition so you can measure the initial shock, the degraded window, and the time it takes the service to return to normal.
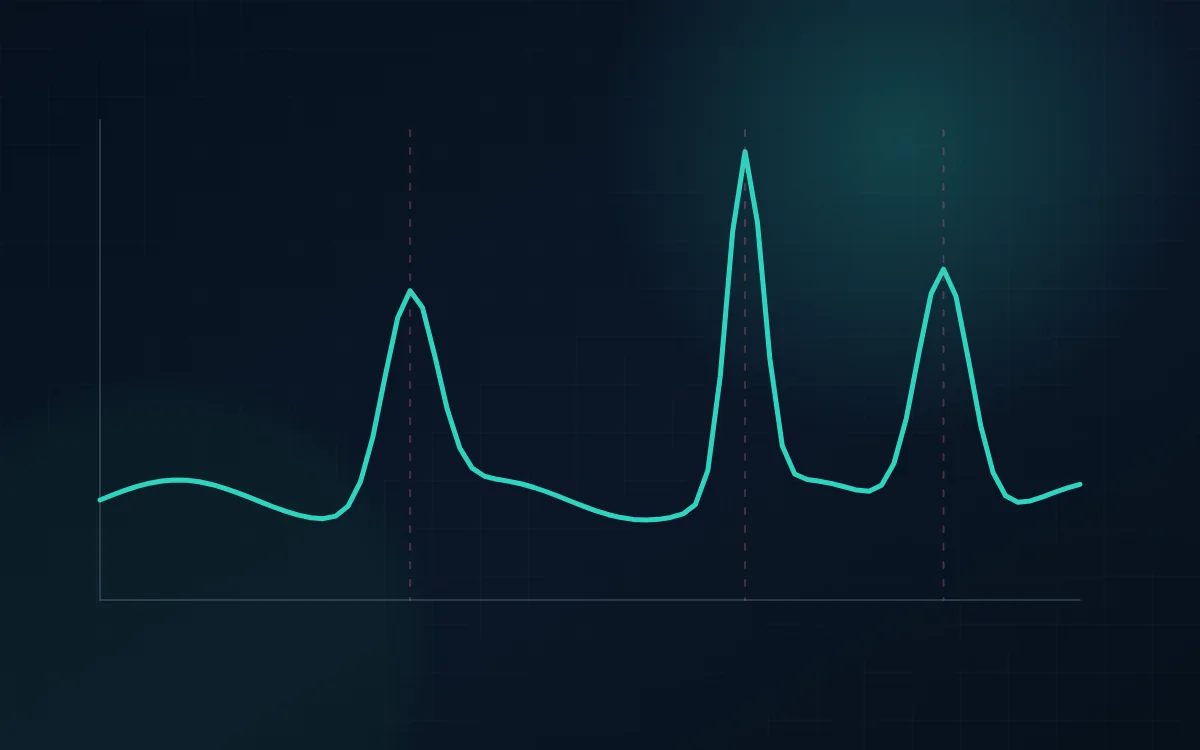
How steeply does traffic jump?
What queues, caches, pools, or autoscalers react first?
Does the service settle before the user-visible SLO is lost?
A good spike test preserves the timeline. The useful question is not “did the average look fine?” but “what happened in the seconds between the burst and useful capacity?”
A system may sustain a high rate after caches warm and new instances become ready yet still fail during the transition. Spike testing focuses on that transition, where connection bursts, cold starts, cache misses, locks, and defensive limits can activate together.
Reproduce how fast traffic changes, not only the final peak. A jump from 100 to 1,000 RPS in seconds exercises different behavior than a ten-minute ramp to the same level.
Measure the interval between demand arriving and new capacity becoming useful. If latency explodes during that window, pre-scaling or a better trigger may matter more than a higher maximum replica count.
A brief slowdown can cause clients, gateways, or jobs to retry, turning one burst into a self-reinforcing wave. Compare failures with achieved throughput so retry amplification does not disappear inside aggregate traffic.
A launch often shifts demand to new products or content. A burst against uncached data can reveal origin, database, or search pressure hidden by a warm steady-state benchmark.
Queues, background jobs, open connections, and circuit breakers can keep a service unhealthy after the external surge ends. Continue the run through the cooldown period.
Replay the same burst after pre-warming, queue limits, rate controls, autoscaling changes, or cached fallbacks. The identical event shape turns resilience work into a measurable before-and-after result.
Use the expected multiplier and arrival timing as the test design. A credible spike profile is built from the real event shape, not from a generic desire to “send a lot of traffic.”
Run ordinary traffic first so pre-spike latency and errors are known.
Increase demand at the speed expected from the real notification, launch, or traffic event.
Keep the peak present while caches, autoscaling, queues, and dependencies react.
Drop back to baseline instead of ending immediately; recovery is part of the result.
Use the same burst after pre-scaling, cache warming, gateway tuning, or queue changes.
Spike testing is about rate-of-change. A system can handle a high steady load and still fail when demand arrives too quickly for autoscaling, connection pools, caches, or downstream services to react. A useful spike test therefore models the jump itself, the short peak, and the recovery period as separate phases.
Start from a realistic baseline and define how quickly traffic should jump: for example, from normal demand to several times normal within seconds rather than over a gradual ramp. The size of the jump matters, but the slope often matters more because it determines whether protective mechanisms have time to react. Use an endpoint mix that reflects the event you are worried about. A ticket drop may concentrate reads and checkout attempts; a notification campaign may cause login and feed refreshes; a cache purge may increase expensive origin reads. Avoid converting the whole scenario into one generic endpoint because that can hide the exact dependency that is vulnerable to the surge. Hold the spike long enough to observe whether the system catches up or continues accumulating work, then return to baseline traffic. Record both the maximum instantaneous arrival rate and the completed throughput. If incoming demand jumps sharply while completed requests increase slowly, the difference is being absorbed by queues, clients, gateways, or retries, and that backlog is part of the risk you are trying to measure.
Sudden traffic exposes components that appear healthy after they have warmed up. A cache can show excellent hit rates during a long load test but perform poorly during the first seconds after a deploy or invalidation. Autoscaling may eventually add enough instances but leave users exposed to elevated latency while new capacity starts. TLS handshakes, DNS lookups, token verification, connection establishment, JIT compilation, lazy initialization, and database connection creation can all become disproportionately expensive when many clients arrive at once. Track cache hit rate, connection creation, instance count, queue depth, and dependency calls during the first seconds of the spike, not only averages over the entire test. Compare the first spike with a second identical spike after the system is warm. A large difference indicates that initialization or cache state contributes materially to the risk. That finding can lead to concrete mitigations such as pre-warming, minimum instance counts, longer-lived connections, more conservative cache invalidation, or staged campaign delivery.
A traffic spike can become a self-amplifying incident when clients, proxies, workers, or SDKs retry failed requests at the same time. During the test, separate original requests from retries when possible and inspect the timing of error waves. If a downstream service slows, callers may time out and retry while the original work is still running, doubling pressure precisely when the system has the least spare capacity. Exponential backoff and jitter are designed to reduce that synchronization, but they need to be validated under realistic concurrency. Watch for repeated bursts after the initial spike, rising duplicate work, queue age, and a throughput plateau accompanied by increasing attempt volume. Test protective behavior such as rate limiting, load shedding, circuit breakers, and idempotency on write paths. A successful spike response is not necessarily one that accepts every request. For some systems, rejecting excess work quickly and predictably is safer than allowing all requests to enter a queue where they eventually time out and consume resources for much longer.
The test should continue after traffic drops. A spike that lasts thirty seconds can leave several minutes of queued work, saturated pools, cache churn, or delayed background jobs. Measure the time from the end of the spike until latency, error rate, queue depth, and resource usage return to the baseline envelope. If autoscaling added capacity, observe how scale-in behaves as well; an aggressive scale-in policy can remove instances while the system is still draining work. Check whether downstream rate limits remain triggered, whether circuit breakers reopen cleanly, and whether scheduled or asynchronous work has been displaced by the burst. Repeat the same spike after tuning to see whether recovery gets shorter even if the absolute peak throughput does not change. For launches or campaigns, turn the result into an operational plan: determine the maximum safe send rate, minimum warm capacity, queue budget, and threshold at which traffic should be shaped. That makes spike testing directly useful for an event rather than a one-time benchmark.
Spike evidence is only useful when it keeps the timing of the shock intact; coarse summaries hide the few seconds where queues, retries, and autoscaling diverge.
A spike can disappear inside one-minute averages. Retain fine-grained requested rate, completed throughput, concurrency, error rate, and latency around the jump. Mark the exact start and end of the burst so autoscaling, cache misses, connection creation, and queue growth can be aligned to the traffic shock rather than averaged across the full test.
Where possible, count logical actions separately from HTTP attempts and label retry responses. Save 429s, timeouts, gateway errors, and client retry timing. This lets you determine whether a 2x user spike became a 3x or 4x backend spike because callers repeated failed work, and whether backoff actually spread recovery traffic.
Continue collection until queues, autoscaling, cache behavior, and latency return to normal. Record the longest-lived backlog and how quickly it drained. For campaign readiness, translate the result into a maximum safe send rate, minimum warm capacity, and an action threshold for waiting rooms or traffic shaping.
Translate the burst into an event rule: how quickly traffic may arrive, how much warm capacity must exist, and which control activates if the arrival rate exceeds that envelope. That makes the test useful for campaign, launch, notification, or outage-recovery planning instead of leaving operators with only a peak graph.
LoadTester is a strong fit when the risk comes from demand arriving faster than infrastructure can adapt. A repeatable burst plus live latency and error metrics makes event-readiness changes easy to compare.
The production testing checklist covers blast radius, target monitoring, stop conditions, and rollout patterns for tests where a traffic burst could affect shared systems.
Open the production testing checklist →The page now centers the time-domain behavior unique to a spike: arrival slope, protection, backlog, and recovery.
Reviewed by Kristian Razum, founder & principal engineer at LoadTester. Technical claims are framed as test-design guidance; no benchmark numbers are invented on this page.
Spike testing measures how a system handles a rapid increase and decrease in demand. The peak matters, but the main focus is the transition: whether the system absorbs the shock, adapts fast enough, and returns to normal afterward.
Stress testing usually increases load until the capacity boundary is reached or exceeded. Spike testing can stay below that theoretical capacity yet still fail because traffic arrives too quickly for scaling, caches, connection pools, or queues to adapt.
Base it on a plausible event. Historical launch data, notification audiences, campaign behavior, ticket inventory, or known retry patterns are better inputs than an arbitrary 10x multiplier.
Test both states when they matter. A warm-cache run shows best-case operational behavior, while a cold or partially cold run can reveal origin and database risk during a launch or content shift.
Build the burst, hold the peak, and measure how fast the system actually recovers.