LoadTester vs k6: a side-by-side comparison
Most "k6 alternative" articles are written without ever opening k6. This one isn't. Below you'll find a real k6 script, the equivalent LoadTester scenario, an honest section on where k6 is the better tool, and a CI/CD comparison that mirrors how teams actually wire load tests into release pipelines.
Quick verdict
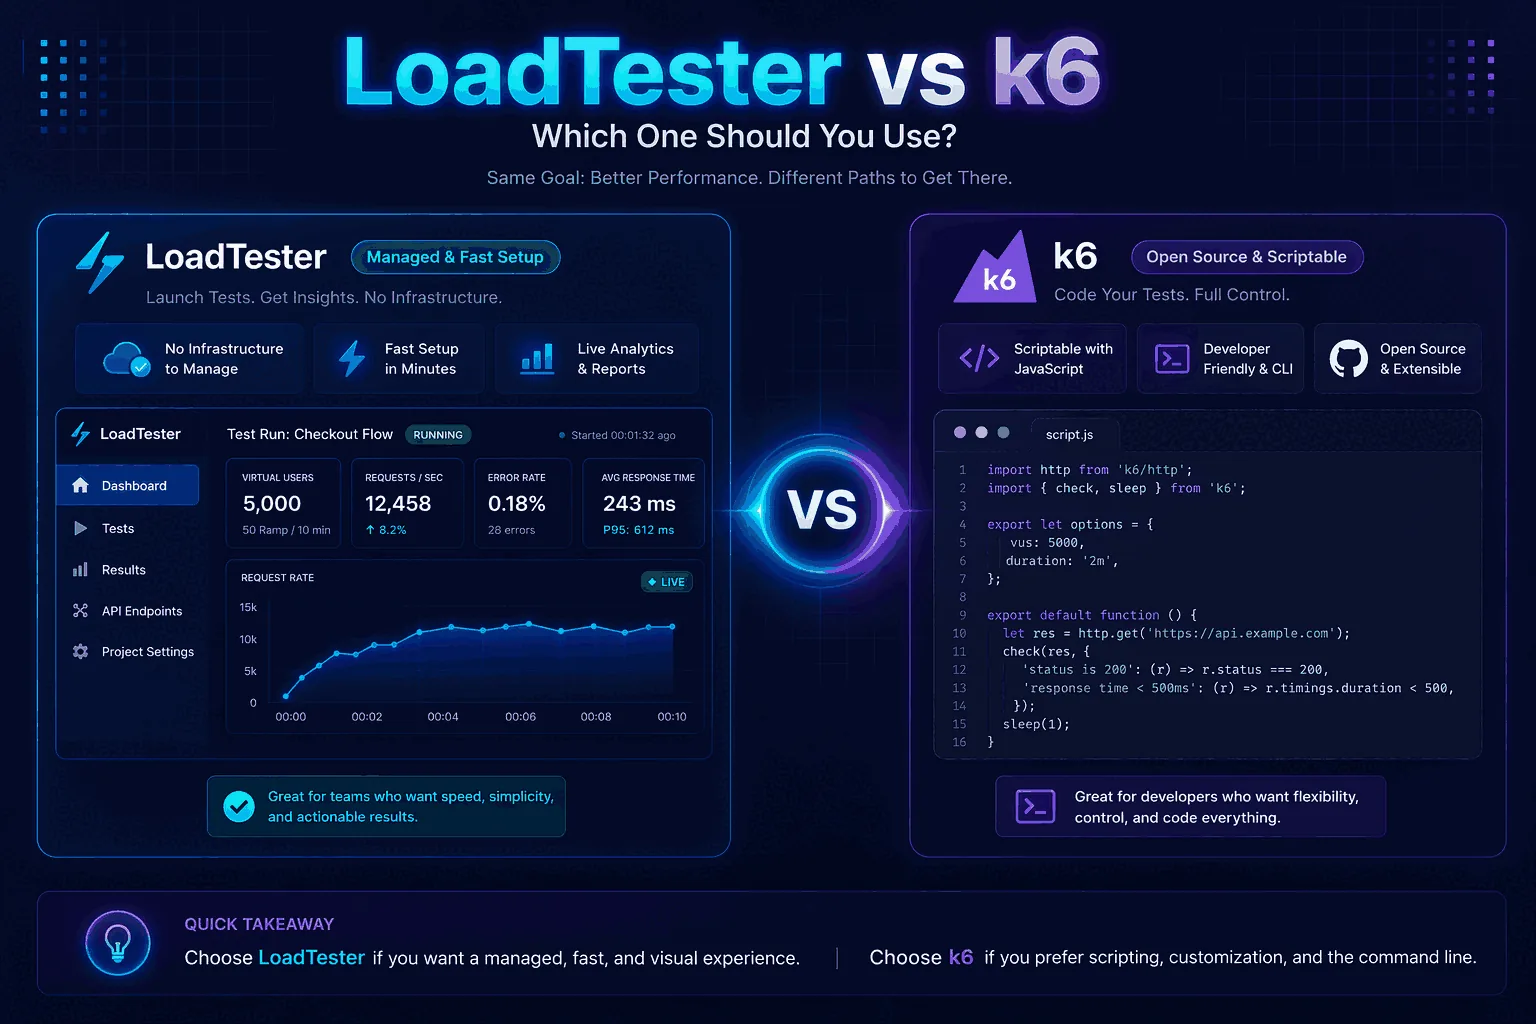
The core tradeoff is code-first flexibility versus managed repeatability. k6 is attractive when JavaScript scenarios are the source of truth; LoadTester is attractive when teams want saved API checks, historical comparisons, and easier cross-team review.
The same test, written two ways
The scenario: 200 virtual users hitting POST /api/checkout on a staging endpoint for 60 seconds, with a JSON body, bearer token, and a p95 threshold of 400 ms. Here is what that looks like in k6:
// k6: checkout.js
import http from 'k6/http';
import { check, sleep } from 'k6';

export const options = {
  vus: 200,
  duration: '60s',
  thresholds: {
    http_req_failed:   ['rate<0.02'],
    http_req_duration: ['p(95)<400'],
  },
};

const TOKEN = __ENV.API_TOKEN;

export default function () {
  const res = http.post(
    'https://staging.example.com/api/checkout',
    JSON.stringify({ sku: 'TEST-1', qty: 1 }),
    { headers: {
        'Content-Type':  'application/json',
        'Authorization': `Bearer ${TOKEN}`,
    }}
  );
  check(res, { 'status is 200': (r) => r.status === 200 });
  sleep(1);
}
You run it with k6 run --env API_TOKEN=$TOKEN checkout.js. The same scenario in LoadTester takes a different shape — there is no script file. You define the request, headers, body, VU count, duration, and thresholds in the test builder, and the platform stores the definition so anyone on the team can rerun it without touching code:
In LoadTester, the same checkout scenario is configured as a saved test definition instead of a JavaScript file:
- Create a new HTTP test and choose
POST. - Paste the staging checkout URL, for example
https://staging.example.com/api/checkout. - Add the JSON request body and the required headers, including
Content-Type: application/jsonand the bearer token. - Set the traffic model to 200 virtual users, a 60 second duration, and any ramp-up your release check needs.
- Add a success assertion for the expected HTTP status and a p95 threshold of 400 ms.
- Run the test, then use the saved result page for the summary, p95 latency, response-code breakdown, exports, and future reruns.
The practical difference is ownership: k6 keeps the scenario in code, while LoadTester keeps the same intent in a reusable team workflow that non-authors can rerun and review.
What actually differs (and what doesn't)
An honest observation up front: against any single endpoint, both tools produce essentially the same numbers. Both generate HTTP load competently, both measure latency the same way, and both can saturate a target server until you hit its real capacity ceiling. If you run k6 and LoadTester back-to-back against the same staging URL with the same VU count, the p50, p95, and error rate will agree within noise. That isn't where the choice is made.
The choice is made in everything around the run:
| Workflow stage | k6 (CLI, single binary) | LoadTester |
|---|---|---|
| From "I want to load test this" to first result | Install k6, write the script, set the env var, run, parse stdout | Sign up, fill the form, click Run |
| Where the result lives afterward | stdout by default; Grafana/InfluxDB/Prometheus if you wire a sink | Permanent run page with a shareable URL |
| Comparing today's run to last week's | You diff JSON exports yourself | Built-in run comparison view |
| Letting a PM read the result | Screenshot the terminal, or send the Grafana dashboard URL | Send the run link |
| Distributing load across regions | k6 OSS is single-node; cloud workers via k6 Cloud (Grafana subscription) | Managed cloud workers included |
| Editing a test that someone else wrote | Read the JavaScript, edit the JavaScript, hope it still passes lint | Open the test, change the field, save |
None of these gaps are dealbreakers in isolation. They compound. A team that builds a Grafana dashboard, sets up CI summary parsing, and enforces a JavaScript style guide for load tests can absolutely make k6 work — many teams have. The question is whether that's the work you want to be doing.
CI/CD: the same release gate, two integration shapes
If you're using k6 in GitHub Actions today, your workflow probably looks like this:
# .github/workflows/perf.yml — k6
- uses: grafana/setup-k6-action@v1
- run: k6 run --quiet --summary-export=summary.json checkout.js
  env:
    API_TOKEN: ${{ secrets.STAGING_TOKEN }}
- name: Fail build if p95 over budget
  run: jq -e '.metrics.http_req_duration.values["p(95)"] < 400' summary.json
It works. The maintenance cost is the script, the summary parsing, and the Grafana/InfluxDB sink if you want history. Equivalent gate in LoadTester:
# .github/workflows/perf.yml — LoadTester
- run: |
    curl -sf -X POST https://api.loadtester.org/v1/runs \
      -H "Authorization: Bearer $LT_TOKEN" \
      -d '{"test_id":"checkout-spike","wait":true}' \
      | jq -e '.passed == true'
  env:
    LT_TOKEN: ${{ secrets.LOADTESTER_TOKEN }}
The threshold lives on the test definition itself, not in the YAML, so changing the budget doesn't require a PR to the workflow file. Trade-off: you give up the ability to express thresholds as arbitrary JavaScript predicates. For most release gates that's a fair trade; for some it isn't (see the next section).
Where k6 is genuinely the better tool
This is the section most "alternative" articles skip. There are real cases where k6 is the right answer and LoadTester isn't:
- You need full programmatic control over the request loop. k6 lets you write arbitrary JavaScript between requests — branching, computed payloads, dynamic correlation extracted from previous responses, custom checks. LoadTester's scenario builder covers the common 80% but doesn't replace a Turing-complete test runner.
- You depend on the k6 extension ecosystem. xk6-browser for browser-based protocol testing, xk6-sql for database load, xk6-kafka, xk6-redis. If your test plan needs gRPC, WebSocket, or a custom protocol via xk6, k6 is the obvious choice.
- You want everything in Git, including the test definitions. Some teams have strong opinions that all infrastructure-as-code, test definitions included, must live in their repo. k6 scripts fit that world; LoadTester's scenario-as-stored-record doesn't.
- You're running fully air-gapped. k6 runs locally with no outbound calls. LoadTester is a managed cloud service; if your security model forbids that, k6 OSS is the answer.
- Cost at very high volume. k6 OSS is free at any scale on your own infrastructure. If you're running multi-million RPS regularly and have the ops capacity to manage k6 cloud workers yourself, the math eventually favors self-hosted.
Where LoadTester tends to win
The mirror image of the above. LoadTester is the better fit when:
- The team running tests is mixed. QA, product, support — anyone who needs to rerun a checkout test before a campaign without learning JavaScript. The UI-first model lowers the bar dramatically.
- You want history without operating Grafana. Every run is permanently stored, comparable, and shareable as a link. With k6 you get this by setting up an InfluxDB or Prometheus sink and a Grafana dashboard, which is its own project.
- Release gates need to be approachable. A product manager can read a LoadTester run page and understand if the build is OK. They cannot read raw k6 stdout. This sounds like a soft point but it's the difference between performance testing happening every release vs. quarterly.
- You don't want to maintain workers. Scaling k6 to 50,000 VUs means provisioning machines, distributing the script, aggregating output. LoadTester does that as a managed service.
Run both yourself
The scripts above are complete. To compare on your own endpoint:
- Save the k6 snippet as
checkout.jsand run it:k6 run --env API_TOKEN=<token> checkout.js - In LoadTester, create a test from the dashboard with the same URL, headers, body, VUs, and duration. Free plan is enough for a single 60s run at 200 VUs.
- Compare what happens after the run, not just the numbers during it. Where does the result live? Who else can read it? How do you compare it to last week?
If "after the test" matters more than "during the test," LoadTester is worth a try. If it doesn't, k6 is excellent and free.
How this comparison was evaluated
For the k6 comparison, we evaluated two different operating models: code-first testing with JavaScript and managed HTTP/API testing with saved workflows. The criteria included scenario expressiveness, CI ownership, threshold handling, dashboard needs, history, team access, and maintenance burden.
k6 should win when script control, extensions, and developer-owned tests are the requirement. LoadTester should win when the team wants repeatable API performance evidence with less code and less surrounding infrastructure.
When k6 is the better answer
- Your team writes JavaScript and wants every load test as code in Git, reviewed via PR like everything else.
- You depend on k6's extension ecosystem (xk6-browser, xk6-sql, xk6-kafka) for protocols beyond HTTP.
- You need fully air-gapped execution with no outbound calls — k6 OSS runs locally with zero external dependencies.
- You're operating at multi-million-RPS scale and have ops capacity to manage k6 workers yourself; the math eventually favors self-hosted.
Questions teams ask before choosing
Can I migrate my existing k6 scripts to LoadTester?
For most simple HTTP scenarios, yes — the configuration maps directly: VUs, duration, headers, body, thresholds. Custom JavaScript logic (computed payloads, dynamic correlation, custom checks) is the part that doesn't translate. We have a migration walkthrough covering the common cases.
Does LoadTester support thresholds as expressive as k6's?
For p50/p95/p99 latency, error rate, and request rate — yes, with operator and value. For arbitrary metric expressions (e.g., "p95 of requests with status 200 only, in the last 10 seconds, must be under 300ms"), no. k6 wins there because it's a programming language.
Won't LoadTester measure differently from k6?
Not in any way that affects the decision. Both tools measure server-side latency the same way (request sent → response received) and both saturate a target until it hits its real capacity. Differences in raw numbers are usually load-generator placement (cloud region, network path), not the tool itself.