HTTP load testing tool: what to look for
There are many ways to generate HTTP traffic. A browser-based service, a command-line utility, a test-as-code framework, or a managed platform can all count as an HTTP load testing tool. That is why teams often find the category confusing. On paper, most tools can “send requests.” In practice, the difference is not whether they can produce traffic. It is whether they help your team answer performance questions clearly and repeatedly.
Choosing the wrong tool is common because teams compare features in isolation rather than matching the tool to their workflow. A lightweight CLI may be perfect for a developer doing a quick check, while a growing product team may need live dashboards, historical comparison, and recurring test schedules. An older tool may look capable, but if it is hard to maintain and nobody trusts the results, it is not helping the team.
This guide explains what to look for before you choose an HTTP load testing tool in 2026. It focuses on the evaluation points that matter in practice: metrics, usability, team fit, CI/CD integration, scalability, and reporting. It also explains where LoadTester fits when a team wants practical HTTP and application load testing without managing the infrastructure. For broader buyer guidance, see Best Load Testing Tools (2026).
Why the choice matters
HTTP load testing is usually done to answer one of a few practical questions: Can this endpoint handle expected traffic? Did the latest release hurt latency? Does the service stay healthy under concurrency? Will an API launch or marketing event expose bottlenecks?
The tool you choose shapes how easy it is to answer those questions. A poor fit can lead to brittle scripts, confusing logs, and results that nobody trusts. A better fit helps the team generate traffic, interpret p95 and p99 latencies, compare runs over time, and share insights with teammates.
That is why “what should I use?” is not really about the biggest feature matrix. It is about choosing a workflow that the team can sustain.
Quick verdict
Use this buyer guide to separate must-have workflow features from impressive but unused tool depth. LoadTester fits when the priority is practical HTTP/API release validation rather than every possible protocol, browser, or scripting feature.
Why LoadTester is different
Http load testing tools is best understood as a broad category ranging from tiny CLIs to code-first frameworks and managed platforms. LoadTester is best understood as a managed workflow for teams that care about repeatability, thresholds, CI/CD, shared reporting, and low operational burden.
That means the comparison is not only about raw request generation. The harder part of load testing is the operating model around the run: storing the scenario, protecting secrets, deciding pass/fail thresholds, comparing results over time, sharing the report, and repeating the same check before the next release. LoadTester moves more of that workflow into the product; HTTP load testing tools keeps more control close to the engineer or existing toolchain.
What LoadTester does better
- Prioritizes the operational checklist. LoadTester covers the pieces many buyers forget to evaluate: saved tests, thresholds, run history, reports, schedules, API access, and team permissions.
- Keeps the focus on HTTP/API outcomes. Instead of presenting every possible performance-testing feature as equal, the workflow centers on whether APIs meet latency and reliability targets under expected load.
- Shortens evaluation cycles. Teams can judge a tool by running repeatable tests and comparing results, not by first building a reporting stack around a runner.
- Makes tradeoffs visible. The page can honestly show where managed convenience helps and where protocol depth, browser realism, or code-first control matters more.
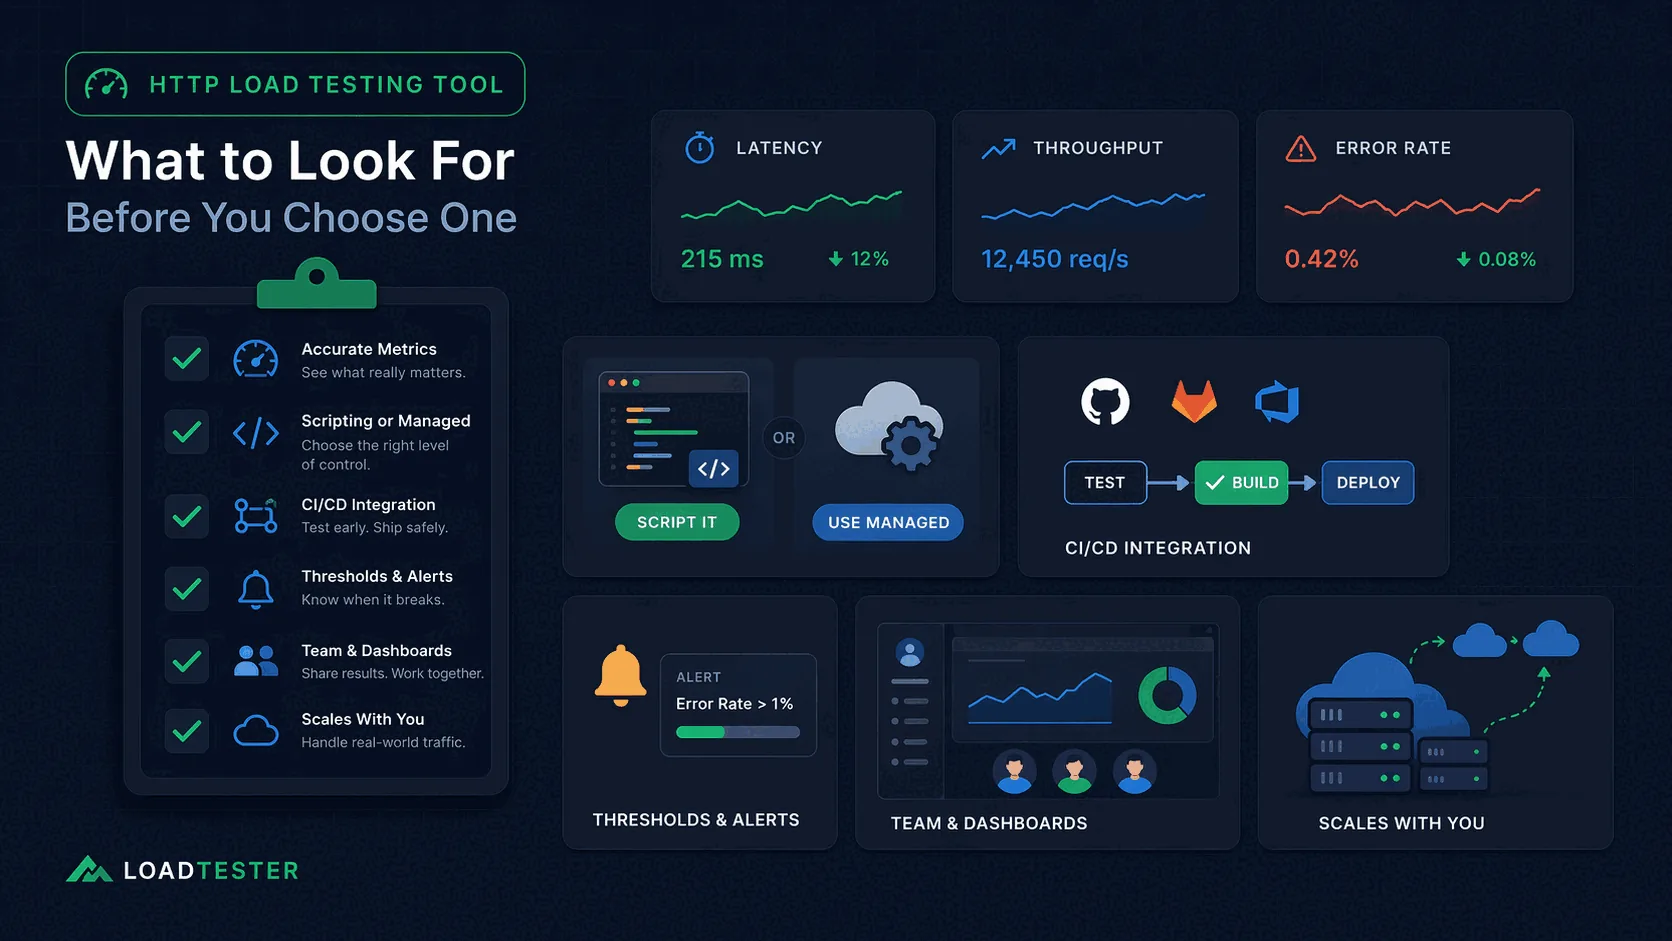
1. Accurate, useful metrics
The first thing to look for is not a long list of advanced protocols. It is whether the tool surfaces the right metrics clearly. That usually includes response times, throughput, error rate, and latency percentiles such as p95 and p99.
If a tool only gives you averages or a vague “success/failure” summary, it may hide the experience of slower users. Teams that care about release quality need to know whether tail latency is worsening, not just whether the average looks acceptable. If you are new to percentile metrics, read p95 vs p99 Latency Explained.
Also pay attention to whether the results are easy to interpret. A good tool makes it obvious how latency behaves as concurrency increases and whether error rates cross thresholds that matter to your users or SLOs.
2. Support for realistic scenarios
An HTTP load testing tool should let you model traffic that resembles real usage. That may include multiple endpoints, headers, authentication, JSON bodies, rate control, concurrency, and test duration.
If you only need a simple burst against a single route, a lightweight CLI may be enough. But many teams quickly discover that production behavior depends on more than one URL. APIs often require tokens, different payloads, or a mixture of reads and writes. Without support for those scenarios, the test may be too simplistic to be useful.
Realistic scenario support is especially important for API-heavy applications, where request bodies, authentication, and concurrency interact in ways that basic tools may not model well.
3. CI/CD integration and automation
By 2026, performance testing should not be something the team remembers to do once a quarter. It should be easy to integrate into CI/CD and release checklists. That means the tool should support automation, reproducible scenarios, and clear pass/fail thresholds.
A tool that can run in a pipeline, export results, or maintain a history of earlier runs is much more useful than one that only works as an ad hoc local test. The more performance becomes part of release confidence, the more this matters. See Load Testing in CI/CD for practical examples.
However, “can run in CI” is not the same as “provides insight in CI.” If all you get is a terminal log without historical comparison or shareable dashboards, the pipeline check may be difficult to interpret over time. That is why many teams ask Is CLI HTTP Load Testing Enough for CI/CD?.
4. Thresholds and alerts
A good HTTP load testing tool should help you define thresholds for latency, throughput, and errors. For example, you may want to fail a build if p95 latency exceeds 300 ms or if the error rate is above 1%.
Thresholds are important because they make tests actionable. Without them, a report may contain a lot of numbers without a clear answer to “Did we pass or fail?”
Some tools stop there. Better workflows also help you surface those thresholds visually, compare them against earlier runs, and share the results with the rest of the team.
5. Reporting and historical comparison
This is one of the biggest differences between simple tools and more complete platforms. A terminal summary is useful, but it is not the same as a shareable report or dashboard. When a release fails or latency starts drifting, the team needs to compare current results with previous baselines.
That means a tool should ideally show how latency and errors evolve over time and provide a way to compare one run with another. Without that, teams are forced to store logs, paste screenshots into chat, and guess whether a change is normal or a regression.
Historical comparison is where managed tools often shine because they are built to preserve, display, and share the results instead of treating every run as isolated.
6. Team fit and maintainability
Not every tool is right for every team. A developer-first CLI may be ideal for a small engineering group that is comfortable writing scripts. A GUI-heavy tool may appeal to testers who prefer a visual interface. A managed platform may suit teams that want simple onboarding, shared dashboards, and less operational overhead.
Ask yourself: Who will create tests? Who will read the results? How hard is it for a new team member to understand and reuse the workflow?
Teams frequently underestimate the maintenance cost of self-managed scripts and test plans. If only one person knows how to interpret the output, or if the scripts require careful local setup, the workflow becomes fragile. A tool that looks flexible on paper may actually slow the team down.
7. Scalability and infrastructure overhead
At some point the question becomes not just “can the tool send requests?” but “how much work is required to run meaningful tests at scale?” Some tools require you to manage your own load generators, tune the client environment, or handle distribution across multiple machines.
That can be fine for dedicated performance engineers, but it becomes a burden for many application teams. A managed platform that handles the infrastructure can save time and reduce operational mistakes.
This is especially important when you want to run recurring tests or share load testing responsibilities across multiple teams.
Where LoadTester fits
LoadTester is designed for teams that want practical application load testing and HTTP load testing without building or maintaining the underlying infrastructure. It provides live metrics, repeatable scenarios, and shareable dashboards so that performance results are easier to understand and compare.
That makes it useful for API testing, website performance validation, CI/CD smoke checks, release comparisons, and recurring regression detection. It is especially attractive for teams that want a simpler workflow than JMeter or a more collaborative workflow than ad hoc CLI tools.
In other words, LoadTester helps when the organization wants performance testing to be repeatable and team-friendly rather than a one-off task buried in logs.
Questions that prevent a bad purchase
What matters more than raw request generation?
Workflow fit matters more: scenario repeatability, thresholding, result clarity, auth handling, and how easy it is for another engineer to rerun the exact same test next week.
How do you avoid buying the wrong tool?
Use one representative scenario, score candidate tools against the same decision criteria, and eliminate anything that cannot support your real release or incident workflow.
When is managed tooling worth paying for?
It becomes worth it when the team needs faster adoption, easier collaboration, better governance, and less time spent maintaining custom scripts or load generators.
These are the official docs, specs, or operational references most relevant to this topic.
How this comparison was evaluated
For this buyer-guide page, we evaluated LoadTester against the checklist a team should use for any HTTP load testing tool: scenario design, ramp patterns, assertions, secrets, CI/CD fit, reporting, collaboration, historical comparison, supportability, and limits.
Because this is not a one-to-one competitor page, the evaluation is category-based. The goal is to help readers choose the right class of tool before they compare individual vendors or open-source projects.
When LoadTester is not the right option
LoadTester is intentionally focused on repeatable HTTP and API load testing workflows. For this page, the honest recommendation depends on whether your team needs HTTP load testing tools for its native strengths or needs LoadTester for repeatable team execution.
- Use browser tools for end-user rendering questions. HTTP-level load tests do not replace real-browser journeys when layout, client-side JavaScript, or front-end timings are the core risk.
- Use protocol-specific tools outside HTTP. Message queues, databases, and streaming systems often need specialized generators and diagnostics.
- Use code-first frameworks for highly dynamic logic. If request behavior is mostly custom branching and data generation, a scriptable runner may be more natural.