JMeter HTTP Requests Tutorial for 2026
Apache JMeter remains one of the best-known performance testing tools. Even in 2026, many teams still use JMeter to exercise APIs, websites, and backend services. One of the most common starting points is the HTTP Request sampler, which lets you configure the method, path, headers, query parameters, and body for an HTTP call.
The challenge is that JMeter can feel heavy for new users. There are many panes, many configuration elements, and many ways to build a test plan that becomes difficult to maintain if you are not careful. That is why a practical tutorial is useful: not just how to click around the GUI, but how to create a simple HTTP test plan that gives meaningful results.
This tutorial walks through JMeter HTTP requests in 2026. We will create a test plan, configure an HTTP Request sampler, add listeners, run the test, and interpret the results. We will also cover common mistakes and explain when teams move from JMeter toward a simpler workflow such as LoadTester. If you are comparing the two, see LoadTester vs JMeter. For API fundamentals, see How to Load Test an API.
Why JMeter is still used
JMeter has survived for a long time because it solves many classes of performance testing problems. It has a GUI, it supports HTTP and other protocols, it lets users define thread groups and assertions, and it can generate detailed reports. Teams with existing JMeter knowledge often keep it because it is already integrated into their internal practices and CI pipelines.
At the same time, many teams who adopt it underestimate the maintenance cost. JMeter test plans can become complicated quickly. It is easy to accumulate nested controllers, CSV data sets, multiple listeners, and assertions that are difficult for new teammates to understand. The result is a powerful but sometimes cumbersome workflow.
That tradeoff is why JMeter is worth learning — but also why modern teams evaluate simpler alternatives when they want faster onboarding and easier collaboration.
Step 1: Create a basic test plan
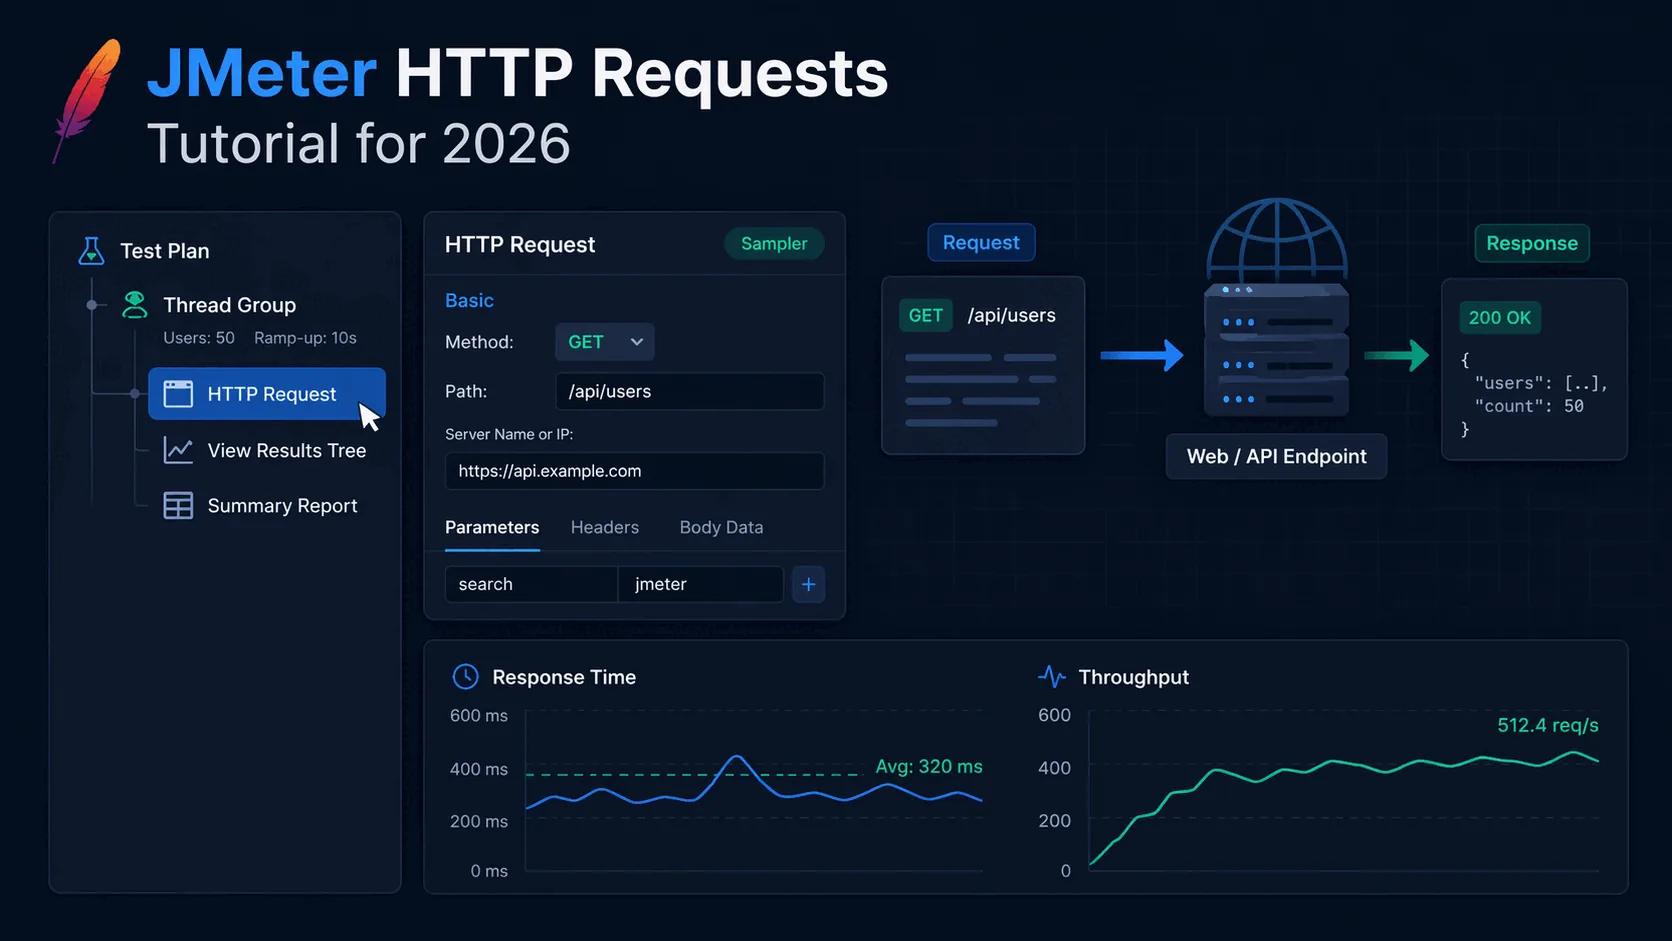
Start JMeter and create a new Test Plan. Under the Test Plan, add a Thread Group. The Thread Group controls how many virtual users run, how quickly they ramp up, and how many times the test repeats.
Number of Threads (users): 50
Ramp-Up Period: 10 seconds
Loop Count: 1
This means JMeter will start 50 users across 10 seconds and run the test once per user. You can later increase these settings as you become more comfortable with the target environment.
Be careful not to jump straight to large values without understanding the capacity of the application and the limitations of the machine running JMeter. Performance testing is most useful when the scenario is deliberate and realistic.
Step 2: Add an HTTP Request sampler
Right-click the Thread Group and add Sampler → HTTP Request. This element defines the request you want JMeter to send.
At minimum, configure the protocol, server name or IP, method, and path:
Protocol: https
Server Name or IP: api.example.com
Method: GET
Path: /api/users
If you want query parameters, add them using the Parameters table. If you need headers such as authorization tokens or content type, add an HTTP Header Manager at the Thread Group or sampler level.
For POST or PUT requests, switch the method and include request bodies through the Body Data field. That makes JMeter suitable for testing APIs with JSON payloads, authentication, or other structured input.
Step 3: Add listeners to inspect results
Listeners determine how JMeter shows results. Beginners often use too many listeners, which can consume memory and slow the test. For learning, two listeners are usually enough:
View Results Tree helps you inspect individual requests and responses. It is great for debugging but too heavy for large-scale runs.
Summary Report or Aggregate Report gives you a compact table of throughput, mean latency, error percentage, and percentile-like summaries.
To add them, right-click the Thread Group and select Add → Listener.
Step 4: Run the test and inspect the results
Once the sampler and listeners are in place, click the green Start button. JMeter will execute the configured requests and populate the selected listeners.
Look at the Summary Report or Aggregate Report. Common fields include Samples, Average, Min, Max, Error %, and Throughput. The most useful metrics often include percentile latencies such as p95 or p99 because they show the slower responses that affect real users.
If you are not already using percentiles in performance analysis, read p95 vs p99 Latency Explained. Averages can look acceptable even when a significant minority of users experience slow responses.
Testing POST requests and headers
Many API tests involve POST or PUT requests with JSON payloads. In that case, change the method to POST and add a HTTP Header Manager with values such as:
Content-Type: application/json
Authorization: Bearer <token>
Then place the JSON body in the Body Data section of the HTTP Request sampler:
{
  "name": "LoadTester",
  "email": "test@example.com"
}
This allows you to simulate realistic API writes and validate how the server handles concurrency, latency, and error conditions under load.
Common JMeter mistakes
One common mistake is using too many GUI listeners during larger tests. This consumes memory and makes the local machine a bottleneck. Another is running JMeter from a laptop and assuming the results reflect server performance alone. The client machine can distort the results if it is resource constrained.
Another frequent mistake is ignoring realistic traffic models. A thread group with an arbitrary number of users and no clear reason behind the values is not much better than a random guess. Think about what kind of traffic you are modeling, what thresholds matter, and what constitutes a failure.
Teams also often stop at averages. That misses real user pain. Percentiles, error rates, and throughput under sustained load are usually more informative than a single average latency figure.
Finally, many JMeter test plans grow messy over time. Keeping plans organized, naming elements clearly, and documenting assumptions is essential if other team members need to understand or reuse the workflow.
When teams move beyond JMeter
JMeter remains powerful, but power is not the same as convenience. Teams often move beyond it when they realize that they are spending more time maintaining test plans and environments than learning from the results.
For example, if the goal is simple HTTP or application load testing with live metrics and easy sharing, a managed platform like LoadTester may be a better fit. It removes much of the setup friction and provides dashboards that are easier to share than JMeter listeners or exported reports.
This is especially useful for teams that want scheduled checks, quick release validation, and historical comparisons across runs. In other words, the question shifts from “How do I configure another sampler?” to “How do we make performance testing easier for the whole team?”
Frequently asked questions
Is JMeter still the right choice for HTTP load testing in 2026?
JMeter remains the right choice for teams that already have a JMeter plan library, internal expertise in the tool, or hard requirements on protocols beyond HTTP (JDBC, JMS, FTP). For new projects, the GUI-first authoring model and XML test plans feel dated compared to code-first tools like k6 or managed platforms. JMeter is most defensible when its non-HTTP protocol coverage is actually being used.
How should HTTP Request samplers be structured for realistic API tests?
Group related requests into a Thread Group that models a single user journey, not a single endpoint. Use HTTP Header Manager for shared headers (Auth, Content-Type) at the Thread Group level rather than per sampler. Parameterize the body and query strings with CSV Data Set Config so every virtual user sends distinct payloads. Add a Response Assertion to every critical sampler so a 200 with a wrong body still fails the test.
What is the right way to interpret JMeter results without misleading yourself?
Ignore the Average column — it hides tail behavior. Look at the 95th and 99th percentile columns, the error rate, and the throughput. Pair Aggregate Report with the Response Times Over Time graph to spot whether latency drifted upward during the run. Always compare to a known-good baseline run; absolute numbers from JMeter on a single laptop are nearly meaningless without a comparison point.
These are the official docs, specs, or operational references most relevant to this topic.